This function plots a flow chart using grViz.
It is restricted to the simple case of sequential exclusions from a single
study population and not suited for CONSORT flowcharts for a
parallel-group study (i.e., a randomized-controlled trial).
The left column describes the flow of the group that ends up
being included. The right column describes exclusions for various
reasons.
Generate the design using make_exclusions.
exclusion_flowchart(design, width = 3)Arguments
- design
Tibble with the following columns:
leftText for the left box of each row.n_leftCount to be shown as 'n =' in the bottom of the left box. To skip, useNA_integer_.rightText for the right box of each row.n_rightCount to be shown as 'n =' in the bottom of the right box. To skip, useNA_integer_.
- width
Minimum width for all boxes. Defaults to
3(inches).
Value
Plot rendered using grViz.
For a design with three rows,
the following pseudo-code would be generated:
  grViz(paste0("digraph flowchart {
    node [fontname = Helvetica, shape = rectangle, width = 4]
    tab1a [label = 'left[1] \nn = ", n_left[1],  "']
    tab1b [label = 'right[1]\nn = ", n_right[1], "']
    tab2a [label = 'left[2] \nn = ", n_left[2],  "']
    tab2b [label = 'right[2]\nn = ", n_right[2], "']
    tab3a [label = 'left[3] \nn = ", n_left[3],  "']

    { rank = same; tab1a; tab1b; }
    { rank = same; tab2a; tab2b; }

    tab1a -> tab2a -> tab3a;
    tab1a -> tab1b;
    tab2a -> tab2b;
    }"))
Details
Note grViz does not automatically
generate line breaks. To avoid extra-wide boxes, manually
supply line breaks using \n. See example.
Example Output
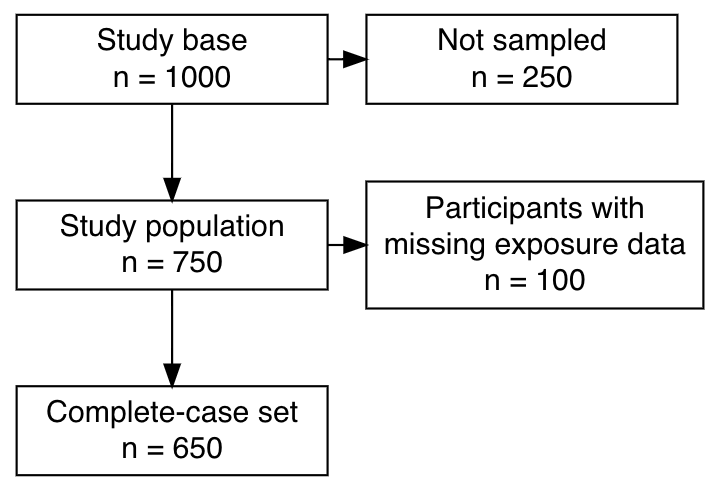
Examples
# Generate a flow chart for two steps of exclusions:
design <- tibble::tribble(
~left, ~n_left, ~right, ~n_right,
"Study base", 1000, "Not sampled", 250,
"Study population", 750, "Participants with\nmissing exposure data", 100,
"Complete-case set", 650, "", NA_integer_)
# Plot
exclusion_flowchart(design, width = 2)